The beloud.now dashboard makes documented experiences of women and FLINTA* visible in space, in time and in their context. Cities and organisations choose their own analysis areas, examine patterns and track developments over time.
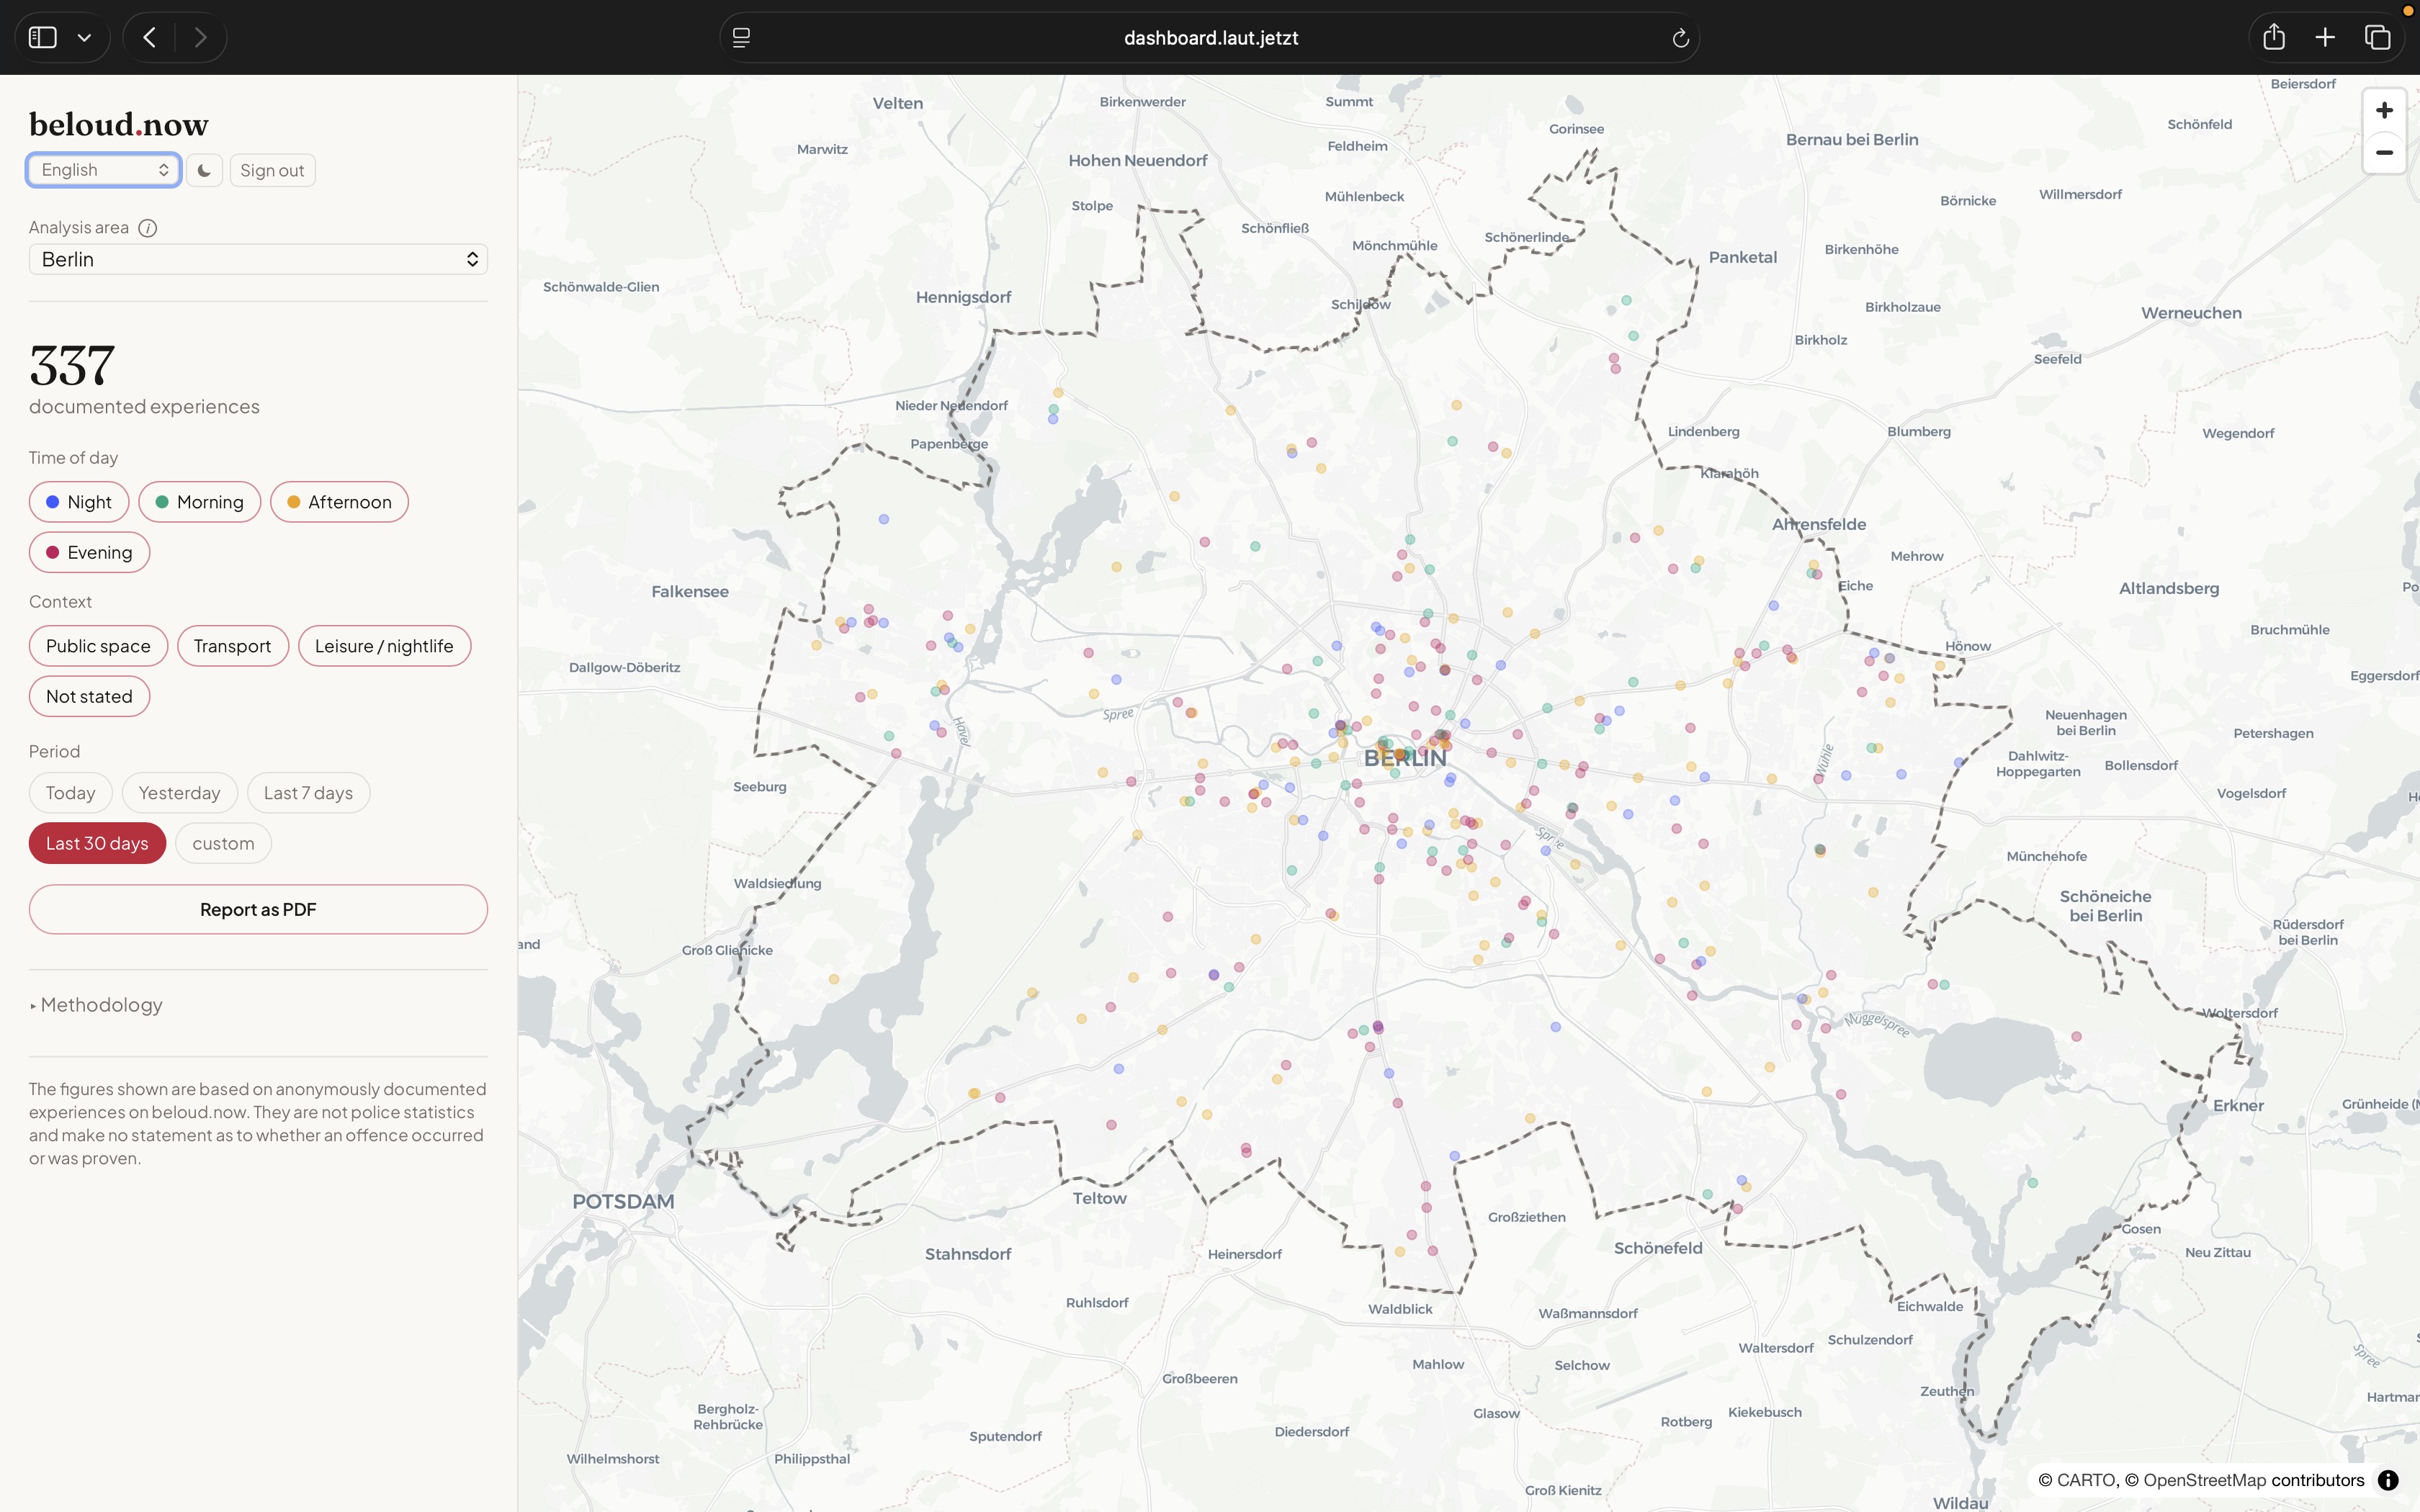
A current look at anonymously documented experiences in Berlin.
Access for cities and organisations
Every plan includes full dashboard access: all filters, the time series, PDF reports and 38 languages. Plans differ in scope, not in features. Annual licence, invoiced, prices excluding VAT.
Local
2.400 €/ year
1 analysis area
unlimited users within the organisation
all filters, time series, period comparison
PDF reports
dashboard in 38 languages
Multi
4.800 €/ year
up to 5 analysis areas
unlimited users within the organisation
all filters, time series, period comparison
PDF reports
dashboard in 38 languages
Organisation
from 6,000 €/ year
more than 5 analysis areas
larger regions, federal states, nationwide
individual configuration and analyses
API on request
Billed annually against an invoice; monthly payment on request with a twelve-month term. We cut the analysis area together with you and check beforehand whether enough documented experiences exist there. Setup takes one to two working days.
You work in research, counselling or a non-profit context and would like to use beloud.now for a specific question? Please get in touch.
The beloud.now Dashboard
Overview: Berlin analysis area. Filterable by location, time and public context.
🗺️
Analysis area
City or defined space.
🕐
Time period
Today, yesterday, last week, last month or custom.
🎛️
Filters
Time of day, public context and period. Category and background fields appear at the individual place depending on the agreement.
📄
Report
Exportable report for a defined area and time period.
Data
Each report provides multiple perspectives.
📍
Location
Where did the experience take place? A report can include a location. The map shows individual places in public space — each coordinate shifted by a random distance of 15 to 25 metres before it is stored. The figures beside it are built from grid cells, not from coordinates.
🕐
Time
When did the experience take place? Time periods and times of day are aggregated for analysis.
📌
Context
In which public context?
🚶 Public space
🚇 Public transport
🎉 Leisure / Nightlife
❔ Not specified
🗂️
Type of experience
What happened? The same detail the public map in the app already shows for every place — from harassment and stalking to physical and sexualised violence.
🧭
Possible motivation, known or unknown
What may have played a role — misogyny, queerphobia, racism or abuse of power? And was the person known or a stranger? Both details are optional when documenting, and they are only unlocked for individual analysis areas where the agreed purpose requires it.
Experiences documented at home or in relationships are not carried over as individual locations — they do not appear on the map. That is a product and privacy decision.
Individual experiences reveal patterns.
A single report says little about a location. Many anonymously documented experiences can show where entries cluster, at which times of day they occur and in which public contexts experiences were reported. The dashboard can be narrowed down by time of day, context and period.
These combinations are illustrative and do not represent specific statements about any particular city.
Has anything changed?
A snapshot says how things are. A time series says where they are going. The dashboard shows how documented experiences develop by day, week or month — for exactly the selection you have filtered.
„We changed the lighting on the station forecourt. Does anything change in the documented experiences after that?“
Two periods can be compared directly. What is compared is the number per day, not the total — periods of different length are otherwise not comparable.
A change does not automatically mean that more or less happened. Fewer documented experiences can also mean that fewer people documented. That is why the dashboard speaks of documented experiences and never of crime.
From the dashboard to a report.
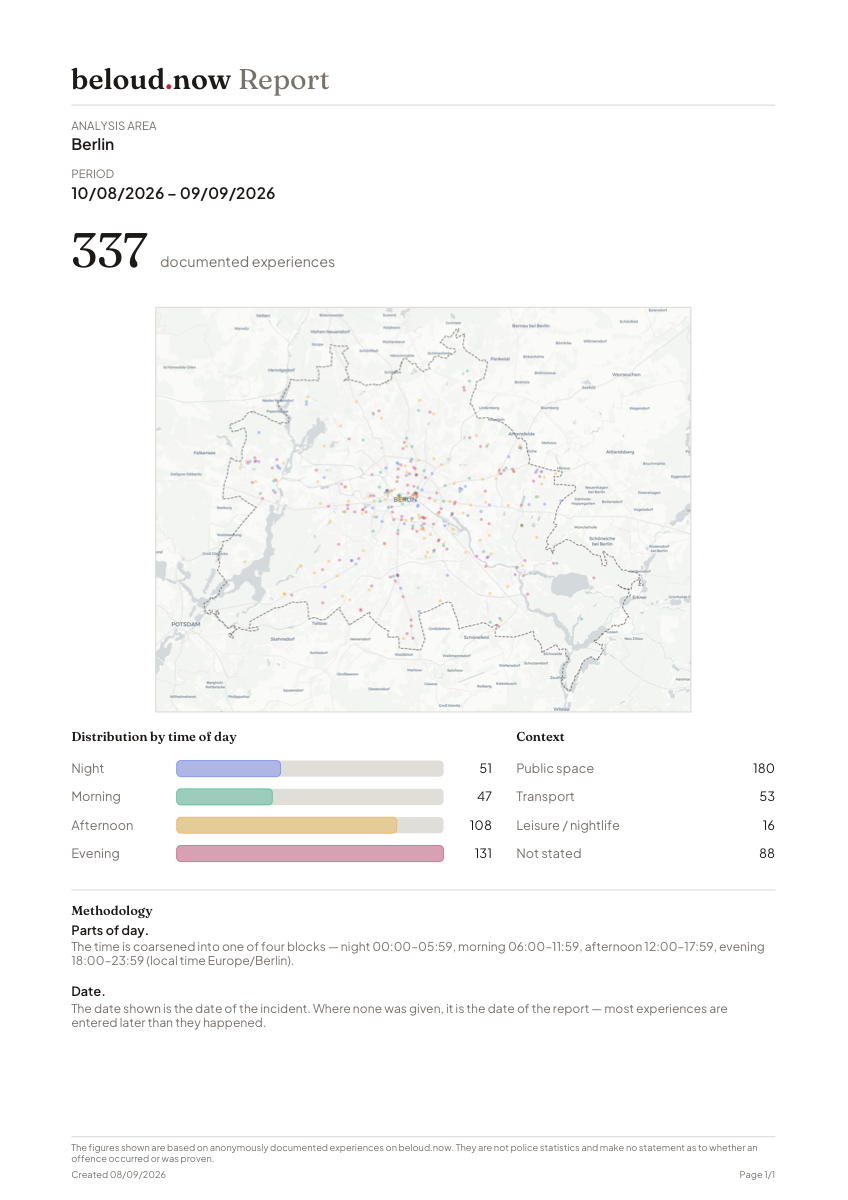
For defined areas and time periods, aggregated data can be summarised as a report.
Example report: Berlin — Last 30 days.
Anonymously documented experiences. Not police statistics. No proof of individual crimes.
The report also includes a methodology explanation: time blocks, handling of missing incident dates and data classification.
Many experiences. Little shared visibility.
Cities already have numerous data sources. beloud.now is not intended to replace any of them. The platform adds something that is only partially visible in traditional statistics: the anonymously documented experiences of women and FLINTA*.
Where do certain experiences occur more frequently?
At what times of day?
In which public contexts?
Which areas deserve a closer look?
Not every answer. But better questions.
Are there specific temporal patterns?
Which public contexts are documented most frequently?
Which areas could be examined more closely during a safety walk?
What questions arise for a safety concept?
Are there indicators that should be considered when planning a city festival?
Which existing measures could be reviewed with an additional perspective?
Also for city festivals and events.
Public events create their own spatial and temporal situations. beloud.now can help to view anonymously documented experiences around defined time periods and public spaces in an aggregated way. This allows safety concepts to be not only planned, but also reflected upon and developed further.
We are already working on a first pilot project with a city for a city festival.
🏙️
Cities & Municipalities
An additional perspective on experiences in public spaces.
🎉
Event organisers
Reflect on safety concepts for city festivals, festivals and events.
🔬
Research
Aggregated data for academic research questions.
💻
Technology partners
We are currently exploring initial cooperations for using aggregated data in other applications.
Data & method
The data rests on voluntarily documented experiences. Whoever makes an entry decides to do so.
It is not representative of all experiences in an area.
The entries are not verified crimes and not police statistics.
A missing entry does not mean that nothing happened there.
The dashboard calculates no danger level for a place and no risk assessment of individuals.
The purpose is a different one: to make patterns visible, to recognise where action may be needed and to plan prevention more precisely.
Privacy is part of the product.
🗺️
Counts, not reports
The dashboard gives the number of documented experiences in the current selection.
🕐
No exact time of day
An individual place carries a calendar day and a part of the day — night, morning, afternoon, evening. The exact time is not stored for it.
🏠
Public space only on the map
Individual locations come only from public space, public transport and leisure, or carry no context at all.
🔐
Separate access
The dashboard does not access the report database directly.
What beloud.now is not.
Not police statistics
The data represents anonymously documented experiences of women and FLINTA*.
Not a danger map
A higher number of documented experiences does not automatically mean a location is objectively more dangerous.
No personal assessment
No individuals are evaluated.
No public prosecution
Reports are not legally verified statements of fact.
No surveillance
The dashboard is not intended for identifying or tracking individual women or FLINTA*.
Dashboard in 38 languages
The dashboard interface and its data labels are fully available in 38 languages — from German and English to Greek, Arabic, Ukrainian and Japanese. Arabic is set right to left. The language can be fixed per organisation.
The terms in the dashboard come from the same translation system as the app. They are not translated separately. What the reporting person ticked therefore means exactly the same thing in the analysis — in every language.
This product page itself is currently available in German and English.
New applications with aggregated data
We are open to cooperations with applications that incorporate spatial and temporal information about public spaces. We evaluate individually for each use case which aggregated data can be provided in a privacy-compliant and meaningful way.
What do women and FLINTA* experience in your city?